Typical Super Bowl scores
Updated for 2023!
In this activity students study historical Super Bowl data to reflect on average (mean, median, and mode), losing scores, winning scores, and range of scores. They are asked to judge which of these central measurements seem the most meaningful and explain their reasoning. Doing this activity right before the Super Bowl? Consider trying this:
Ask students to predict the score of the Super Bowl.
Then show kids the scores from the past Super Bowls (in the activity) and ask them if they want to make a new prediction.
Determine the average Super Bowl score from the data. Keep a record of the predictions, adjustments to predictions, the mean and median of past scores.
Reflect on this the day after the Super Bowl. What prediction was the closest? Did the past data help? What other information might be helpful in predicting the score of the Super Bowl? After students complete the activity, refer back to the interactive box whisker plots from plot.ly at the bottom of this post. You can review many of the questions from the activity sheet and easily manipulate the data and plot through our plot at plot.ly.
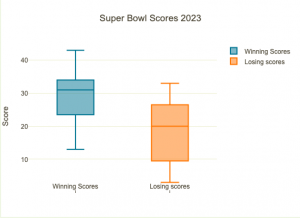
Extension: This is a fine context and set of data to explore absolute mean deviation with your class. Absolute mean deviation is a big part of CCSS standard 6.SP.B.5c It is a measure of how much the values in the set deviate from the mean. Or create and/or analyze box whisker plots comparing winning scores with losing scores.
For Adventurer members we've given you an editable Word docx, the Exel sheet with our calculations, and the solutions.
Find your next lesson
400+ real-world activities, each with a worksheet and answer key.
Browse the library
Comments (0)