2023-11-20 09:44:51
March Equinox - big deal? ... and 5 more Spring activities
March Equinox - big deal? ... and 5 more Spring activities

What's with the March Equinox? Does it really affect our lives? Is it just some astronomical occurrence? Students calculate the daylight hours at the March Equinox by time between longest and shortest days. They examine the progression of those daylight hour changes and look for a pattern.
For Adventurer members we have an editable Word docx, our Excel work, and our solutions.
And more Spring activities
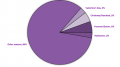 Holiday candy sales (2017) - Students translate a pie chart of information on candy sales to actual dollars spent for various holidays. They then ponder the incredible amount spent in America on candy. 6.RP.3 , 7.RP.3 7.EE.3
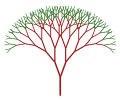 Python Tree(2021) - We let students see a tree leafing out with the use of a fractal and the start of appreciating recursion. We used the Python programming language and asked students to figure out what the program is saying to do ... without Python instructions. Pretty, fun, and important in our world today. 4.OA, 5.OA, 8.F, MP7, MP8, HSF.IF
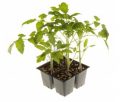 Planning to plant seeds (2016) - It's time to get ready to plant my garden again. Here in Boston we have to start our seeds indoors to give them a head start before we can put plants outside. The seed packages tells me how many weeks early to plant seeds indoors and how long the seeds will take to sprout. That's a lot of counting backwards. This activity introduces students to the use of spreadsheets to count the time between planting indoors and planting outdoors. HSF.BF, HS.M, HSA.REI, HSA.CED
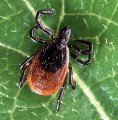 It's tick time again (2021) - With Excel graphing or graphing by hand, use our data from the CDC to find the growth of Lyme in your state and engage in hypothesizing why that growth or decline might be occurring. What are your odds of contracting Lyme this year? 5.MD, 6.SP, 7.RP, 7.SP
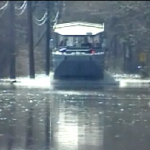 The Geometry of flooding (2010) - Students are given data on spring rain amounts and rise in river level. They then calculate the volume of water generated by inches of rain spread over the surface area. Specific river catchment areas are then considered to understand the actual voluminous rise of the river. Once the volume of water is calculated, students are asked to find approximate river depth change for a hypothetical rain event. 5.MD, 6.G, 6.EE, 6.RP, 7.G, 7.RP, HSG, HSF
Comments (0)
Display 1 - 10 Of total 0
The odds of horse race betting
Rich Strike surprised everyone at the Kentucky D...
The Forever Roll
That's a big roll of toilet paper! &...
Will this be an El Niño winter?
The Oceanic Niño Index (ONI) started to show cha...
Madden Glitch
It's the talk of the town. Madden video games ha...
USPS needs help!
The U.S. Postal Service has been in the news lat...
First ipad
Image by catalyststu...
Gauss and our star of stars
How many stars are in thi...
Valentine's Day Activities (Compilation)
Happy Valentine...